Dubai real estate statistics — 2026
Every number on this page comes from individual sales registered with the Dubai Land Department in January–September 2026 — 95,878 apartments and 9,481 villas, aggregated by us and refreshed monthly. Not listings, not press releases: registered prices buyers actually paid.
Dubai property market, Jan–Sep 2026: the key statistics
- Dubai registered 95,878 apartment sales worth AED 175.4 billion in Jan–Sep 2026, plus 9,481 villa/townhouse sales worth AED 37.5 billion — 105,359 residential deals, AED 212.8 billion combined.
- The median apartment sold for AED 1,225,000 (AED 1,712 per sqft); the mean was AED 1.83M — luxury deals pull the average 49% above the median.
- The median villa sold for AED 3,250,000 (AED 1,751 per sq ft of plot).
- 76% of apartment sales were off-plan (72,530 of 95,878) — buyers paid a 26% per-sqft premium over ready stock (AED 1,769 vs AED 1,400).
- 71% of all purchases are studios or 1-bedrooms: 38,737 one-beds (40.4%) and 29,527 studios (30.8%). The median studio cost AED 673,000 (390 sqft), the median 1-bed AED 1,247,079 (776 sqft).
- Only 3.7% of sales closed above AED 5M, and 1.1% above AED 10M — the market's core is AED 1–2M (36.5% of all deals).
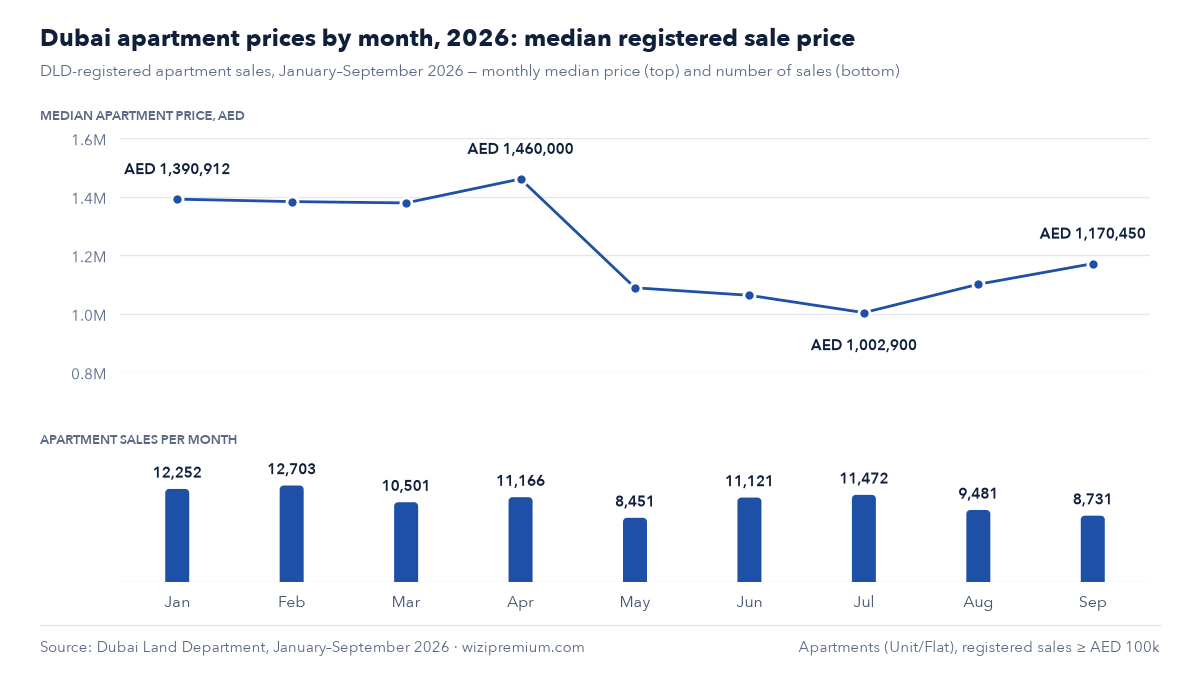
- The busiest month was February (12,703 sales), the slowest May (8,451) — a 33% drop from peak after the February 28 regional escalation; June recovered to 11,121 and July held at 11,472; August eased to 9,481 and September to 8,731, the quietest month since May.
- The most active area was Dubai South / Madinat Al Mataar: 11,272 apartment sales, 100% off-plan, ahead of JVC (7,171) and Dubailand Residence Complex (4,767).
- The priciest zone (≥100 deals) was Marsa Dubai at AED 4,448/sqft; the cheapest, International City Phase 1 at AED 702/sqft — a 6.3× spread within one city.
- The single largest registered deal was an AED 422,000,000 apartment at Aman Residences Dubai (Jumeirah Second); the largest villa sale: AED 260,000,000, a ready villa at EOME on Palm Jumeirah, registered in September.
- The top-selling project was Azizi Venice 14 — 1,953 sales in nine months, ahead of DAMAC Lagoons Valencia (1,278) and Maybach Six (1,032).
- 97.8% of transactions happened in freehold areas — foreign-eligible ownership is the market.
Each statistic above stands on its own — cite freely with a link to this page (see «Methodology & citation» below). Source for all figures: DLD registered sales, Jan–Sep 2026, our aggregation.
Sales by month: the correction in one chart
Registered apartment sales per month. The February 28 escalation shows up as a March–May slide (−33% from the February peak by May); June and July turned back up, then August and September eased again. Medians wobble with the mix — from May they skew affordable as off-plan launches in Dubai South and Dubailand dominate registrations (the low: AED 1,002,900 in July):
| Month | Apartment sales | Median price | Off-plan | Villa sales |
|---|---|---|---|---|
| January | 12,252 | AED 1,390,912 | 73% | 2,092 |
| February | 12,703 | AED 1,382,566 | 70% | 1,529 |
| March | 10,501 | AED 1,378,000 | 78% | 1,249 |
| April | 11,166 | AED 1,460,000 | 80% | 1,056 |
| May | 8,451 | AED 1,087,969 | 78% | 589 |
| June | 11,121 | AED 1,062,115 | 79% | 763 |
| July | 11,472 | AED 1,002,900 | 77% | 747 |
| August | 9,481 | AED 1,100,000 | 75% | 692 |
| September | 8,731 | AED 1,170,450 | 72% | 764 |
Prices above are DLD-registered transactions, not portal asking prices. Source: Dubai Land Department open data, aggregated by WIZI PREMIUM.
Registrations lag signings by days to weeks, so the escalation's demand hit lands mostly in March–May numbers. Villa sales follow the same curve at one-tenth the volume. August is restated to 9,481 sales (previously 9,280): it now includes late registrations dated 31 August that arrived in DLD's next file. September may be revised the same way next month.
What Dubai actually buys: studios and 1-beds
Bedroom mix of all 95,878 registered apartment sales (DLD records the room count for ~100% of deals). The investor profile is unmistakable — compact stock dominates:
| Type | Sales Jan–Sep | Median price | Median size, sqft | AED/sqft |
|---|---|---|---|---|
| Studio | 29,527 | AED 673,000 | 390 | 1,737 |
| 1 bedroom | 38,737 | AED 1,247,079 | 776 | 1,635 |
| 2 bedrooms | 21,708 | AED 2,188,729 | 1,248 | 1,753 |
| 3 bedrooms | 5,201 | AED 3,898,408 | 1,855 | 2,086 |
| 4+ bedrooms | 674 | AED 12,000,000 | 3,972 | 3,081 |
Price distribution: where the deals cluster
Share of the 95,878 apartment sales by registered price band. More than a third of the market trades under AED 1M; the AED 1–2M band is the fattest at 36.5%:
Off-plan vs ready: the 26% premium
Off-plan units registered at a median AED 1,769/sqft against AED 1,400 for ready stock — a 26% premium for payment plans and new product. That gap is the number to watch in the correction: it compresses if off-plan demand cools:
| Segment | Sales Jan–Sep | Median price | AED/sqft | Share |
|---|---|---|---|---|
| Off-plan | 72,530 | AED 1,243,558 | 1,769 | 76% |
| Ready (resale & handover) | 23,348 | AED 1,150,000 | 1,400 | 24% |
Top 10 areas by transaction volume
| Area | Sales Jan–Sep | Median price | AED/sqft | Off-plan |
|---|---|---|---|---|
| Dubai South (Madinat Al Mataar) | 11,272 | AED 772,350 | 1,703 | 100% |
| JVC — Jumeirah Village Circle | 7,171 | AED 1,000,000 | 1,456 | 59% |
| Dubailand Residence Complex | 4,767 | AED 806,850 | 1,423 | 91% |
| Majan | 3,915 | AED 720,999 | 1,423 | 84% |
| Business Bay | 3,539 | AED 2,080,000 | 2,404 | 54% |
| Dubai Islands (Palm Deira) | 3,289 | AED 2,862,828 | 2,808 | 100% |
| City of Arabia (Dubailand) | 2,527 | AED 611,000 | 1,702 | 99% |
| Arjan | 2,414 | AED 939,755 | 1,587 | 64% |
| Dubai Production City | 2,311 | AED 974,600 | 1,345 | 77% |
| Jabal Ali First (Azizi Central / Sobha Central / Jebel Ali Village) | 2,293 | AED 1,655,000 | 1,658 | 98% |
Prices above are DLD-registered transactions, not portal asking prices. Source: Dubai Land Department open data, aggregated by WIZI PREMIUM.
Most expensive per sqft
- Marsa Dubai — AED 4,448/sqft (329 deals)
- Business Park — AED 3,575/sqft (1,574 deals)
- Palm Jumeirah — AED 3,558/sqft (706 deals)
- Dubai Harbour — AED 3,544/sqft (278 deals)
- Palm Jabal Ali — AED 3,508/sqft (324 deals)
Most affordable per sqft
- International City Ph 1 — AED 702/sqft (1,085 deals)
- Remraam — AED 952/sqft (170 deals)
- Discovery Gardens — AED 960/sqft (771 deals)
- Dubai Investment Park First — AED 1,072/sqft (1,218 deals)
- Liwan — AED 1,100/sqft (565 deals)
Zone names as registered by DLD (≥100 deals threshold). «Marsa Dubai» is DLD's marina-adjacent registration zone — a distinct polygon from the Dubai Marina community pages use. Full 103-area table lives in our price index (link below).
Record deals and top projects of Jan–Sep 2026
Top-selling projects, Jan–Sep 2026
- Azizi Venice 14 — 1,953 deals
- DAMAC Lagoons – Valencia — 1,278 deals
- Maybach Six — 1,032 deals
- Azizi Venice 6 — 938 deals
- Binghatti Skyflame 1 — 767 deals
Largest registered deals, Jan–Sep 2026
| Registered price | Type | Project | Area |
|---|---|---|---|
| AED 422,000,000 | Apartment | Aman Residences Dubai | Jumeirah Second |
| AED 356,232,500 | Apartment | Aman Residences Dubai | Jumeirah Second |
| AED 260,000,000 | Villa | EOME | Palm Jumeirah |
| AED 225,965,000 | Apartment | The Alba Residences by Omniyat | Palm Jumeirah |
| AED 220,000,000 | Villa | AMALI ISLAND | The World |
What a square metre in Dubai actually costs
A square metre in Dubai cost AED 18,514 between January and July 2026 — about $5,041 — measured across all 77,666 apartment sales registered with the Dubai Land Department. Listing portals quote higher, and on averages they quote much higher: three to four times the registry. Both numbers are arithmetically true. They describe different things, and only one of them is what buyers paid.
| What is compared | Advertised | Registered | Gap |
|---|---|---|---|
| Villas, average price | AED 13,022,850 | AED 3,968,808 | 3.3× |
| Villas, advertised average vs median deal | AED 13,022,850 | AED 3,200,000 | 4.1× |
| Apartments, top of range | AED 1,230,000,000 | AED 422,000,000 | 2.9× |
| Apartments, "prices from" | AED 183,632 | AED 599,000 | −69% |
| Median price per m² | ~AED 19,110 | AED 18,514 | +3% |
Advertised figures as published by the portals themselves: the villa average and the apartment range are Bayut's own stated numbers; the "from" price is Emirates.Estate's stated entry point ($50,002); the per-m² median is our own count across 13 listing cards on the first page of a large Russian-language Dubai catalogue on 15 August 2026 — a small sample, quoted as indicative only. Registry figures: DLD Sales-group residential transactions, deduplicated by transaction number, apartments Unit/Flat ≥AED 100k, villas Building/Villa ≥AED 300k. The AED 599,000 is the 10th percentile of registered apartment sales.
Why the averages diverge and the medians agree
The pattern in that table is the whole story. On averages the gap is multiples; on the median it is three percent. Two mechanisms produce that.
First, a portal shows inventory, and inventory is not the market. A villa listed at AED 80M that nobody buys stays on the site for years and keeps lifting the advertised average every day it sits there. The registry only records closings, so an unsold trophy asset never enters it at all. Second, the average is dragged by that tail while the median is not: move the top 1% of listings and the mean jumps, the median barely twitches. Which is why the medians of the two sources end up almost on top of each other — they are both describing the ordinary middle of the same market, where things actually transact.
The practical rule follows directly. Ignore any "average price" quoted from listings — it is arithmetically correct and practically useless. Use medians, and prefer medians of registered deals, because that is the only number that means "someone paid this".
What Google currently answers
Ask Google in Russian how much an apartment in Dubai costs and its AI Overview replies that a square metre averages $5,400–5,800. That figure sits above both numbers we measured: above our registry median of $5,041 and above the ~$5,200 asking median from the catalogue sample. We are not going to guess how the answer was assembled — but a reader who takes it as the market price is budgeting from the advertised side of the market, and from the upper part of it.
If you cite one number for the price of a square metre in Dubai, the defensible one is AED 18,514 / $5,041, and it should be cited with its period (January–July 2026), its source (Dubai Land Department) and its type (median of registered sales, not asking prices). Every figure on this page can be recomputed from the open DLD file — that is the point of publishing the method alongside the number.
Methodology — and how to cite these numbers
Source. Individual sales transactions registered with the Dubai Land Department (open data), January 1 – September 30, 2026. We de-duplicate by transaction number, keep residential Sales only, and split apartments (Unit/Flat, ≥AED 100k) from villas and townhouses (Building/Villa, ≥AED 300k). Price-per-sqft uses DLD's actual area with a 100–30,000 AED/sqft sanity band; medians, not averages, headline every table because Dubai's luxury tail distorts means by ~50%. The latest month is provisional: late registrations keep arriving in DLD's next file, so September may be revised (August was restated this way, from 9,280 to 9,481 apartment sales).
What this is not. Not listing prices (registered prices run below asking), not developer press releases, not projections. Index-style price movements live in our price index; interpretation and scenarios in the market report. This page refreshes monthly when DLD's next batch lands.
«According to WIZI PREMIUM's analysis of 95,878 DLD-registered sales, …» — with a link to this page. All figures are free to reuse with attribution (CC BY 4.0). Journalists: for a custom cut of the data (area, segment, month), write to hello@wizipremium.com — same-day turnaround.
Common questions
How many properties were sold in Dubai in 2026?
Between January and September 2026 the Dubai Land Department registered 95,878 apartment sales (AED 175.4 billion) and 9,481 villa/townhouse sales (AED 37.5 billion) — 105,359 residential deals worth about AED 212.8 billion combined. Full-year 2026 numbers will depend on the fourth quarter; this page updates monthly. That is roughly 385 registrations a day, and 97.8% of them went through freehold zones open to foreign buyers. February was the busiest month with 12,703 apartment sales; May the quietest with 8,451, before June rebounded to 11,121 and July held at 11,472; August eased to 9,481 and September to 8,731.
What is the average price of an apartment in Dubai?
The median registered price in Jan–Sep 2026 was AED 1,225,000 (AED 1,712 per sqft). The arithmetic average was AED 1.83M — 49% higher, dragged up by a luxury tail that includes deals up to AED 422M. Median is the honest yardstick; anyone quoting «average» prices is including that tail. The core of the market is far more modest than the headlines: 36.5% of all deals closed between AED 1M and AED 2M, and only 3.7% above AED 5M. For villas and townhouses the median was AED 3,250,000 at AED 1,751 per sq ft of plot.
What share of Dubai property sales are off-plan?
76% of Jan–Sep 2026 apartment registrations (72,530 of 95,878) were off-plan. Off-plan traded at a 26% per-sqft premium to ready stock — AED 1,769 vs AED 1,400 — the price of payment plans and new product. The pattern is driven by launch-heavy districts: the busiest zone of the period, Dubai South (Madinat Al Mataar, 11,272 sales), was 100% off-plan. Watch that premium through the correction — it is the first number that compresses if off-plan demand cools.
What do buyers actually buy in Dubai?
Compact investor stock: 40.4% one-bedrooms and 30.8% studios — together 71% of all Jan–Sep 2026 deals. Median studio: AED 673,000 for 390 sqft; median 1-bed: AED 1,247,079 for 776 sqft. Only 3.7% of deals closed above AED 5M. At the other end only 1.1% of deals closed above AED 10M — the luxury segment that dominates headlines is a thin slice of actual trading. The compact mix reflects investor demand: studios and one-beds are the easiest units to rent out in high-yield districts like JVC and Dubai South.
Which Dubai area is the most expensive per square foot?
Among zones with 100+ registered deals in Jan–Sep 2026: Marsa Dubai (AED 4,448/sqft), Business Park (AED 3,575), Palm Jumeirah (AED 3,558) and Dubai Harbour (AED 3,544). The cheapest: International City Phase 1 at AED 702/sqft — a 6.3× spread across the city. Price per square foot is the honest way to compare areas, because unit sizes differ hugely between them. The record single deal of the period — an AED 422,000,000 apartment at Aman Residences Dubai — sits in the same top tier of waterfront zones.
Where do these statistics come from?
From sales registered with the Dubai Land Department (open data), January–September 2026, aggregated by us: de-duplicated, residential only, apartments ≥AED 100k. These are prices buyers actually paid — typically below portal asking prices. The dataset refreshes monthly; figures are free to cite with a link. Medians, not averages, headline every figure — a handful of nine-digit deals would otherwise distort the picture. For a custom cut of the data — by area, segment or month — email hello@wizipremium.com; journalists get a same-day turnaround.
The data pages behind these numbers
Get a shortlist priced against DLD data
Tell us your budget and target area — we'll send options priced against the registered DLD median for their buildings, so you see exactly what is above and below the real market. WIZI PREMIUM — Property Finder Awards 2025 winner (Quality Brokerage, Dubai Boutique).